Marketplace Analytics: Turning User Activity into Better Business Decisions
Running a marketplace without analytics is like shooting an arrow in the darkâÂÂyou may be moving, but you cannot see the target or know whether your efforts are taking you closer to it.
A marketplace can receive visitors, publish hundreds of listings and generate enquiries, yet its administrators may still struggle to answer essential questions:
- Which listings and categories attract the most interest?
- What are visitors searching for?
- Which searches return no results?
- Are promoted listings actually generating clicks and leads?
- Where do users leave the journey before making an enquiry?
- Are mobile visitors converting differently from desktop visitors?
CubiqWeb Marketplace includes an analytics system designed to answer these questions. It does more than count visits. It connects user activity across listings, dealers, searches, forms, comparisons, promotions and leads, then presents the results through practical reports and charts in the Admin panel.
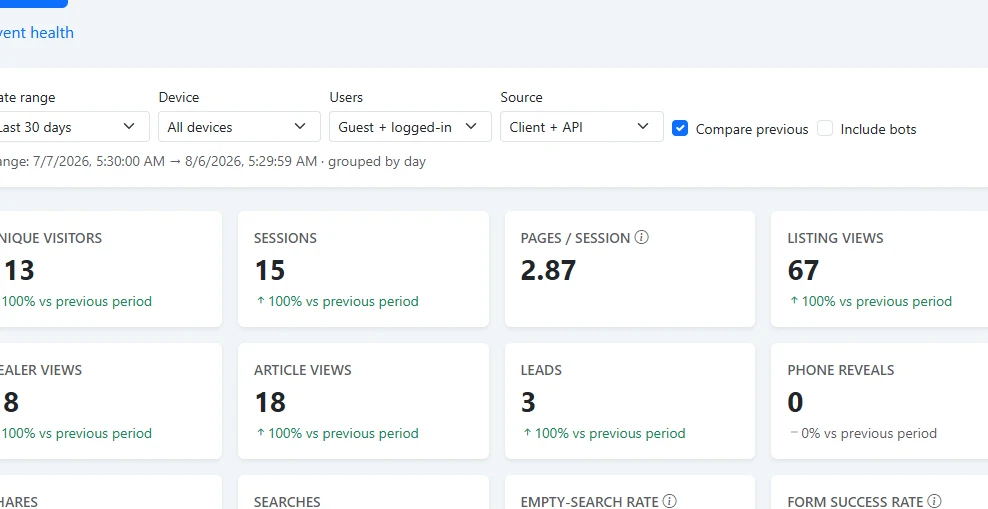
Image placeholder: CubiqWeb Admin Analytics overview showing key performance indicators and charts.
From activity to actionable insight
Raw numbers are useful only when they help someone make a decision. Knowing that a marketplace received 10,000 page views is encouraging, but it does not explain what visitors wanted, what they engaged with or why they did not convert.
CubiqWeb connects related events to reveal the journey behind those numbers. Administrators can see how users move from a listing card to a detail page, then to a phone reveal or enquiry. They can examine searches that produced results, searches that returned nothing and forms that users could not complete successfully.
This turns analytics into a decision-making tool rather than a collection of disconnected statistics.
What CubiqWeb Marketplace tracks
The analytics module records activity across the most important areas of a marketplace.
Traffic and audience
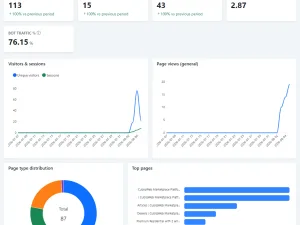
CubiqWeb tracks page views, unique visitors, sessions and pages viewed per session. Reports can also separate guest and logged-in users, desktop and mobile devices, and human traffic from detected bots.
This helps administrators understand whether traffic is growing, which pages bring users into the marketplace and how different audiences interact with it.
Listing, dealer and article engagement
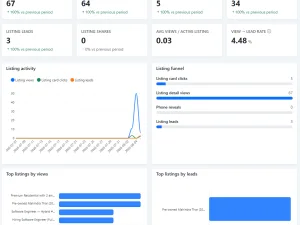
The system records listing detail views, dealer profile views and article views. It also tracks important engagement actions, including listing-card clicks, shares, phone reveals and enquiries.
Because a marketplace owner repeatedly opening their own listing could distort the figures, owner views can be excluded automatically. Duplicate view windows also prevent repeated refreshes from being counted as completely new interest.
Marketplace searches
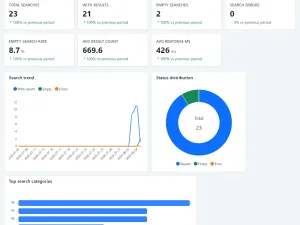
Search behaviour is one of the clearest expressions of customer demand. CubiqWeb records whether a search returned results, no results or an error, together with useful dimensions such as category, listing type, location, applied filters, result count and response time.
Search terms are sanitized before reporting, and sensitive information is not retained as unrestricted analytics metadata.
Forms and enquiries
CubiqWeb can record public form attempts and their outcomes, including successful submissions, validation failures and server errors. It can also identify invalid fields and measure how long a form took to complete.
This makes it possible to distinguish between a lack of customer interest and a form that is creating unnecessary friction.
Listing comparisons
When visitors open a comparison containing two or more listings, the analytics module can record the comparison size, listing type and comparison group. Administrators can then see how frequently comparison is used, the average number of selected listings and which listings appear most often.
Promotions and paid visibility
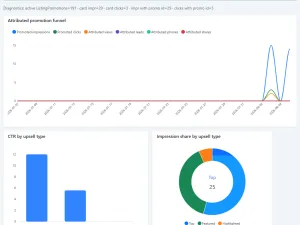
For promoted listings, CubiqWeb can record an impression only after the card has been meaningfully visible on screen. It can then connect impressions with card clicks and attribute later detail views, phone reveals, shares and leads to the relevant promotion.
This provides a far more useful picture than simply marking a listing as âÂÂfeatured.â It shows whether the additional visibility produced measurable engagement and business outcomes.
Image placeholder: Promotion-performance report showing impressions, clicks, CTR and attributed leads.
Reports designed around business questions
The Admin Analytics area organises the collected data into focused sections instead of presenting one crowded dashboard.
Overview
The overview combines essential marketplace KPIs: visitors, sessions, listing and dealer views, leads, phone reveals, shares, searches, empty-search rate and form success rate. Trend charts and top-performing content tables provide a quick picture of overall marketplace health.
Traffic
Traffic reports show visitor, session and page-view trends, along with top pages, page types and device distribution. These reports help determine where users arrive and which parts of the marketplace deserve further investment.
Listings
Listing reports cover detail views, unique viewers, card clicks, leads, shares and promoted impressions. A listing funnel connects card clicks, detail views, phone actions and enquiries so administrators can identify where prospective customers stop progressing.
Search
Search reports show total searches, successful searches, empty results, errors, average result count and response time. Top categories and sanitized search terms reveal demand that may not yet be adequately supplied.
Leads and conversions
These reports bring together listing enquiries, dealer enquiries, phone reveals and shares. Conversion rates can be compared across devices, helping administrators identify whether the mobile or desktop experience needs improvement.
Promotions
Promotion reports measure impressions, clicks, click-through rate and attributed actions. Performance can be reviewed for individual promotions and different upsell types, helping marketplace teams assess which paid-visibility products provide value.
Forms, comparisons and audience
Dedicated reports show form outcomes, comparison activity, audience type, devices, browsers and operating systems. Together, these views reveal both customer intent and usability problems.
How analytics guides real marketplace decisions
The value of the module becomes clearer when reports are connected to practical actions.
| Analytics finding | Possible business decision |
|---|---|
| A popular search repeatedly returns no results | Recruit sellers or add inventory for that demand |
| Listing cards receive clicks but few detail-page enquiries | Improve listing information, pricing, images or enquiry placement |
| Mobile traffic is high but its conversion rate is low | Prioritise mobile usability and form improvements |
| A category receives strong traffic but has few active listings | Expand that category and approach relevant dealers |
| A promoted listing receives impressions but few clicks | Improve its image, title, price or promotional placement |
| Forms show frequent validation failures on one field | Simplify the field or provide clearer guidance |
| Visitors frequently compare certain listings | Improve comparison data and highlight important differentiators |
| One article attracts traffic that later reaches listings | Produce more content for the same customer intent |
These are the decisions that move a marketplace forward. Instead of relying on assumptions, administrators can identify a measurable problem, make a targeted change and compare the result over time.
Flexible filters and period comparisons
Reports can be filtered by common date rangesâÂÂincluding today, yesterday, the last 7, 30 or 90 days, the current month, the previous month or a custom period.
Administrators can compare a selected range with the equivalent previous period. Each key metric can then show its percentage increase or decrease, making it easier to judge whether a campaign, platform change or seasonal shift had an effect.
Additional filters allow reports to focus on device type, guest or logged-in users, event source, page type and bot inclusion. Chart intervals automatically adapt from hourly to daily, weekly or monthly views according to the selected period.
Image placeholder: Analytics filters and previous-period comparison applied to a trend chart.
Reliable figures instead of inflated counters
Analytics loses its value when the underlying numbers are easily distorted. CubiqWeb therefore includes several safeguards:
- Repeated page and entity views use configurable deduplication windows.
- Listing and profile owners can be excluded from their own engagement counts.
- Client events use unique identifiers to prevent the same event batch from being stored twice.
- Bot traffic can be identified, reported separately or excluded from analysis.
- Event timestamps and values are validated before storage.
- Unknown event types are rejected.
These controls help reports reflect genuine marketplace activity more accurately.
Privacy-conscious collection
CubiqWeb is designed to collect useful behavioural information without treating every piece of visitor data as something that should be stored.
Raw IP storage is disabled by default. Hashed and anonymised network identifiers can support visitor deduplication without keeping the original address. Sensitive URL parameters are removed, metadata has a strict size limit, and blocked fieldsâÂÂsuch as passwords, tokens, email addresses and phone numbersâÂÂare rejected or scrubbed.
This approach keeps analytics focused on marketplace behaviour and performance rather than collecting unnecessary personal information.
Analytics health is monitored too
A dashboard cannot support decisions if its collection pipeline silently stops working. CubiqWeb therefore includes operational checks for conditions such as:
- no analytics events received during the expected period;
- unusually high empty-search rates;
- elevated search-error rates;
- disabled tracking for important event groups; and
- excessive growth in the active analytics table.
Older events can be moved into an archive according to a configurable retention period. This helps keep current reports efficient while retaining historical data separately.
A foundation that grows with the marketplace
The CubiqWeb analytics module is built as a central event pipeline with configurable event groups and report sections. Tracking can be enabled or disabled globally or for particular areas such as page views, card clicks, promoted impressions, searches and forms.
This provides a strong foundation for future capabilities such as seller-facing insights, data exports, additional contact-action attribution and deeper package or upsell reporting.
Stop guessing and start improving
Every marketplace generates activity, but activity alone does not create understanding. The real advantage comes from connecting visits, searches, clicks, comparisons, promotions and enquiries into a clear view of what users want and where the platform can improve.
CubiqWeb Marketplace analytics gives administrators that visibility. It helps them find gaps in supply, improve underperforming listings and forms, evaluate promotions, understand conversions and prioritise development using evidence rather than guesswork.
Running a marketplace without analytics is like shooting an arrow in the dark. CubiqWeb helps businesses see the target, measure the distance and adjust their aim.
Explore CubiqWeb Marketplace
See how CubiqWeb combines flexible marketplace management with analytics built for practical business decisions.